
When I talk with other product managers, I have sometimes detected that they are not so accustomed to using metrics as I do. Obviously, it does not happen in all cases, but I thought it may be a good idea to write a post with the basics about how to measure a product. I hope it will be useful, no matter your current role.
I am going to describe my approach when I have to measure a product, a flow or feature always with the goal to improve it. It may have little differences according to the business goals or what is the domain area of the product manager (for example, she can work on all checkout steps or only the payment one), but it is quite general, and I believe it can be adapted to all scenarios.
Note that this method will work with any digital analytics tool (Google Analytics, Adobe Analytics, Amplitude, Mixpanel, etc.). You only need to know how to configure your tool and/or request a developer to track the behaviour of the users.
Last but not least, keep reading until the end. I have included some interesting tips that I think may help you to get a better result in your work.
Before starting – What do you want to measure?
Before starting, you should answer these three questions:
1. What information do you want to know
It may be the main KPI of your product, a secondary goal, a specific flow, how a feature is used…
2. What will the use of this metric be
Is it for building a dashboard? To improve it, to achieve better results? To learn how it is used? To build a warning notification in case of variations?
3. Which segmentations will be useful
Are we interested in knowing the differences by market? By device type? By marketing campaign? By user type?
Now, we can continue with the measuring process STEP BY STEP, from the general part to more specific ones.
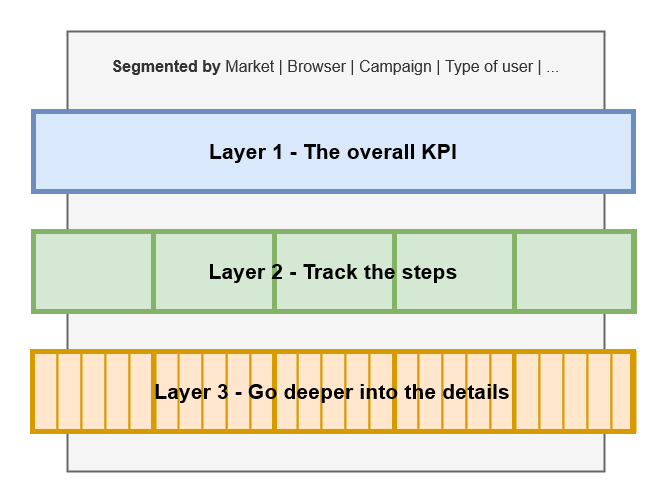
Layer 1 – The overall KPI
The first step is measuring the overall KPI, or the ratio between users who finish / users who start the process.
It helps you to know how successful your product/flow/feature is, and how affect any change that you do over it. It must be a ratio to give them “context”. You can achieve 100 purchases or signups a day, but the result will be very different if you have 1,000 or 1,000,000 users.
Its main use is for daily checks, reports to stakeholders or alarms.
Layer 2 – Track the steps
After the overall KPI, you will need to know how the users go ahead in your product, flow or feature.
So, you will need to measure the steps of these processes. In other words, you need to know how many users arrive at any step of the process. How many steps will depend on your process, but you should try to think of “big” steps (more information below).
As well as the previous stage, you should use ratios (users who continue / users who arrive) to analyse them properly and to be able to compare them.
The main use of these metrics is weekly checks, daily work of product managers and/or specific teams, as well as advanced warning notifications.
Layer 3 – Go deeper into the details
After tracking the steps, you should measure user interactions and technical requests inside of each step.
For example, if your process has a form where the users include their data, you should collect information about each field (time to fill it in, validation errors…) and submit button clicks. Additionally, you should collect information about the console errors as well as server requests and responses in order to check all technical stuff is working properly.
The goal of this layer is to collect information to try to improve the product. You can also use it to know how much a specific feature is used before removing it.
This kind of data is quite detailed, so it is usually only used by the team in charge of this part of the product.
The improvement process
The first layer will help you to monitor the overall performance of the product, flow or feature.
The second one is useful to identify which area has the biggest drop in users so you can identify which of them has higher improvement potential.
And the third one serves to identify which points can be improved in order to avoid the users leaving the process.
So, if you improve a few points in one feature of layer 3, the corresponding step (layer 2) will get better results. And, as a consequence, a better result in one of the steps will signify an improvement in the overall KPI (layer 1).
Easy, right? Well, actually no. In most cases, you will need to use the segmentations previously defined in order to find fields to improve. Do we have the same results for mobile and desktop devices? Are we getting different results depending on the marketing campaign? Do users from Spain behave the same as users from France?
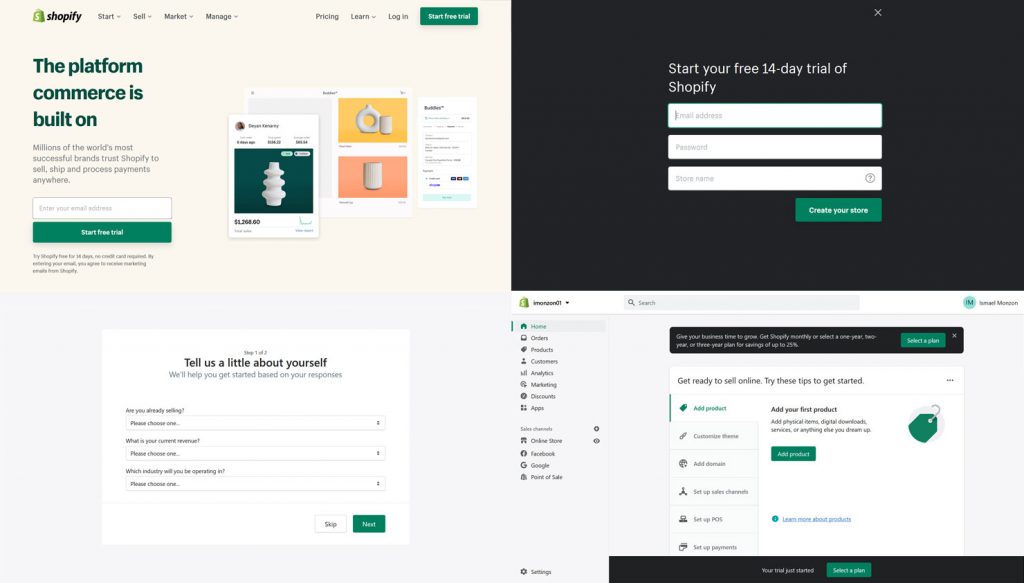
Shopify example
Let’s see an example. Note that it may be difficult to identify the business goals if you are not working for the company, but I am going to do an assumption exercise in order to provide a bit of clarity to this article.
As you may know, Shopify is one of the best SaaS ecommerce platforms. In their mission statement, they say “We help people achieve independence by making it easier to start, run, and grow a business”. So, I can imagine that one of their business goals is having a seamless process for creating a new shop.
Before starting – What do you want to measure?
We would like to know how many users finish the process of shop creation after starting it.
We will use this metric to track how easy the shop creation process is, and try to improve it.
We are interested in understanding the differences by market, by device type and marketing campaign.
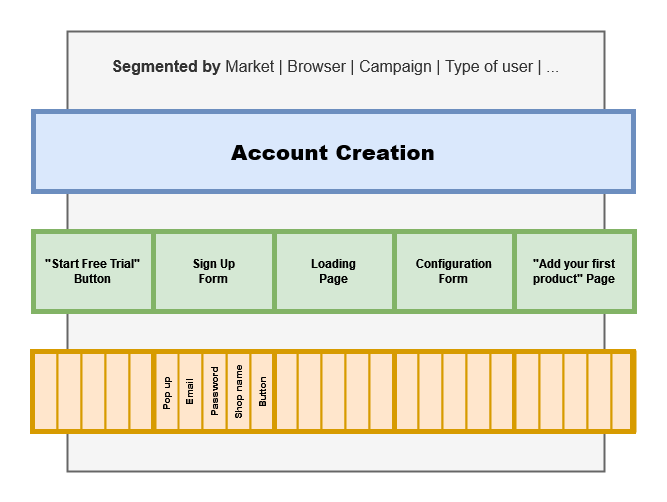
Layer 1 – The overall KPI
Users who arrive at the “Add your first product” page / Users who click on the “Start free trial” button.
Layer 2 – Track the steps
I was able to identify these steps:
- Click on the “Start free trial” button (there are many of them: header, home page, information pages…)
- Sign up form, with 3 fields (email, password and shop name)
- Loading page, or technical process to create the shop (with 3 steps inside)
- Configuration form, with 2 steps (“Tell us a little about yourself” form and Address information form)
- “Add your first product” page
So, we need to track how many users move between these steps:
- Users who arrive at the sign up form / Users who click on the “Start free trial” button
- Users who arrive at the loading page / Users who arrive at the sign up form
- Users who arrive at the “Tell us a little about yourself” form / Users who arrive at the loading page
- Well.. I think it is pretty clear. Go ahead, give it a go.
Layer 3 – Go deeper into the details
For the purpose of this article, I am going to invent that the highest drop in the 6 steps is in step 2, the signup form.
We would start creating a mini funnel and tracking how many users are continuing between fields: Users who arrive at the sign up form > Users who click on email input > Users who fill the email > Users who click on the password input > Users who fill in the password > etc.
Moreover, we would track how much time the users spend filling in each of those fields as well as how many validation errors they get. Finally, we would track the use of additional features such as “?” icon, edit shop name button or “Learn more” link.
Additionally, we would collect information about the technical process. Are there any javascript errors? Is the number of the clicks on the “Create your store” button (without validation errors) the same as the number of users who make it to the loading step (step 3 at layer 2), or if not, we should investigate if we have a technical issue there.
Once we had all this data, we were able to identify the major pain points. I am guessing…
- Password input displays many validation errors about the format. Can we suggest some clues (minimum length, strong format validator…)?
- We see users who spend a lot of time at store name input, so we can assume that they hesitate about it. Can we provide additional help by automatically displaying the tooltip after a few seconds? Can we make it optional? Does it make sense to split this form and to configure it in another step?
- There is a 0.8% difference between users who arrive at the loading step and users who click on the “Create your store” button. Does it happen in any specific country with poor network connection? Does it happen with any obsolete browser version? Do any of our servers have any issues?
The improvement process
We validate these hipoteses with some AB testings, improving by 3% this second step. This rise will get more users making it to the loading page (the technical process to create the shop), which will involve more users at “Tell us a little about yourself” form, which will involve more users… At the end, we get to improve our main KPI by 0.2%, which sounds quite small but in the case of Shopify may mean an improvement of several hundred thousand dollars.
As I wrote above, it is a bit difficult to get an overall view of the business goals of a company when you are not a member of it. For example, does it make sense to get an easy creation process if a user does not add the first product to their shop in the end? How many free trial shops are finally transformed into payment shops? Would it be interesting to try to recover users who left the creation process (after signing up but no information form filled) through email messages?
Some final advice
- Go step by step, in an incremental way as you do with your product. The third layer data will not be useful unless you have information about the first and second layers.
- Nothing is free. When you are defining a new feature or process, you may be tempted to say “We want all data so we are going to track everything”. However, although you may think that implementing an event is only a few minutes of work, the reality is that there are so many hidden costs (QA, maintenance, bugs, cost of licence of analytics tool, etc.)
- Do not worry too much about historical data. Yes, it is important because it will let you make comparisons but, again, you do not need to track everything from the beginning. The strategy of your company, the market or even the world has changed lately, so comparisons will not make sense in many cases.
- Data quality is important. If your data is poor and you take it as a base for assumptions to improve your product, everything in the future will be wrong. Try to compare with other data sources to know how accurate your data is.
I hope this article is useful. If you have any suggestions or ideas, please feel free to share. Feedback is welcome!
Photo Measure by Diana Polekhina on Unsplash
Deja una respuesta